

Page speed describes how quickly a web page displays useful content and responds to a visitor. To improve it, measure real-user performance, identify the largest delays, and fix the images, server responses, scripts, or layout issues responsible. A faster website can reduce friction for customers and support search performance, but it does not guarantee higher rankings, more sales or AI citations.
A potential customer opens your website to compare a service, view a product or contact your team. If the screen stays blank or the contact form responds slowly, that simple task becomes harder.
Website performance optimisation removes those obstacles. This guide explains what to measure, how speed relates to SEO and AI search, and how to prioritise improvements without relying on a perfect test score.
Table of Contents
ToggleWhat is page speed
Page speed is a collection of loading and responsiveness measurements. A page can display its heading quickly but still respond poorly to a button click. It can also load its images quickly while an unexpected banner pushes the content down.
These measurements describe different parts of the experience:
| Measurement | What it tells you |
| Time to First Byte (TTFB) | How long the browser waits for the first byte of the response, including connection and server delays. |
| First Contentful Paint (FCP) | When the browser first renders text, an image or another qualifying piece of content. |
| Largest Contentful Paint (LCP) | When the largest qualifying image or text block visible in the viewport renders. |
| Interaction to Next Paint (INP) | How quickly the page gives visual feedback after clicks, taps and keyboard interactions. |
| Cumulative Layout Shift (CLS) | How much visible content moves unexpectedly, measured using layout-shift scoring rules. |
These are related measurements, rather than a strict four-step loading sequence. A visitor may interact before loading finishes, and layout shifts can occur later in the visit.
Why does website speed matter for a business
Speed matters because it affects the effort required to use a website. Delays can interrupt product research, enquiry forms and checkout. The business impact depends on the audience, traffic source, device and task.
Published research provides useful context:
Google’s 2016 mobile research: Google reported that 53% of mobile visits were abandoned when a site took longer than three seconds to load. This is a historical finding, rather than a universal threshold for today’s visitors.
Portent’s 2022 study: Across 20 B2B and B2C websites, Portent reported ecommerce conversion rates 2.5 times higher at a one-second load time than at five seconds. Its analysis covered more than 100 million page views, with the speed sample drawn from 5.6 million sessions over 30 days.
These findings support investigating performance. They do not establish that your business will receive the same conversion improvement.
For a service website, measure completed enquiries and qualified leads. For an online store, measure completed purchases and revenue. A faster landing page is useful only if visitors can also complete the next step.
Estimate an improvement scenario using your own numbers
Use a scenario calculation rather than turning a published speed comparison into a revenue forecast:
Additional monthly revenue = monthly sessions × current purchase conversion rate × assumed relative conversion uplift × average order value.
For example, consider a store with 10,000 monthly sessions, a 2% purchase conversion rate and a $60 average order value. Current monthly revenue is $12,000. If you choose a hypothetical 10% relative conversion uplift, the new conversion rate is 2.2%, producing an additional $1,200 per month.
That 10% is an assumption for planning. It is not a predicted effect of reducing load time by a particular number of seconds. Test the outcome against your own data, accounting for changes in promotions, traffic and seasonality.
Does page speed affect Google rankings
Yes. Google uses Core Web Vitals in its ranking systems, but good scores do not guarantee higher rankings. Content relevance and usefulness still matter. Improving a slow page is sensible; expecting a specific position increase from a performance score is not.
Google’s Core Web Vitals guidance explains the metrics and their role in Search. Its page experience guidance also cautions against treating report scores as a guarantee of top rankings.
Distinguish three outcomes when evaluating the work:
- User experience: Can customers read, navigate and complete tasks more easily?
- Search performance: Do organic impressions, clicks and relevant landing-page results change over time?
- Business performance: Do qualified enquiries, purchases or revenue improve?
One outcome does not prove the others. Record them separately.
Can slow server responses affect crawling
Slow responses and server errors can reduce Google’s crawling capacity. However, crawl budget management is mainly a concern for large or frequently changing websites. A small business should also investigate indexing directives, canonical URLs, internal links and content quality when pages are missing from Search.
Faster responses do not guarantee indexing.
What are good Core Web Vitals scores
Core Web Vitals cover loading, responsiveness and visual stability. The good thresholds are:
| Metric | Good | Needs improvement | Poor |
| LCP | 2.5 seconds or less | Above 2.5 and up to 4 seconds | Above 4 seconds |
| INP | 200 milliseconds or less | Above 200 and up to 500 milliseconds | Above 500 milliseconds |
| CLS | 0.1 or less | Above 0.1 and up to 0.25 | Above 0.25 |
Evaluate each metric at the 75th percentile of eligible real-user measurements, separately for mobile and desktop. Google’s tools commonly report CrUX field data over a rolling 28-day period. The thresholds describe specific aspects of experience; LCP is not the same as the time required for every resource to finish loading.
LCP Make the main content appear sooner
A large hero image may be an LCP element, but a heading or text block can also qualify. Identify the actual element before changing image settings.
For an image-based LCP, investigate the initial response, the delay before requesting the image, its download time and the delay before rendering. Compression helps download time; it cannot solve every other delay.
INP Make interactions respond promptly
INP assesses clicks, taps and keyboard interactions throughout a visit. Scrolling is not directly included. A prompt visual response matters even when a task, such as submitting information to a server, takes longer to finish.
CLS Keep the layout stable
Reserve space for images, embeds and banners so content does not jump unexpectedly. Review font changes and dynamically inserted elements, especially near buttons and forms.
What is the difference between lab data and field data
Lab data comes from a controlled test. Field data comes from real visits. Use lab tests to investigate causes and field measurements to understand the experience across your audience.
A Lighthouse test can help reveal render-blocking resources and main-thread work. It cannot reproduce every device, network or interaction pattern. A high lab score therefore does not prove that all visitors have a good experience.
PageSpeed Insights may display URL-level field data, origin-level data or no field data, depending on availability. Missing CrUX data does not prove that a page is fast or slow.
Standard navigation-based Lighthouse tests do not measure a visit’s full INP. Use field INP alongside interaction testing when investigating responsiveness.
Does page speed help AEO and GEO?
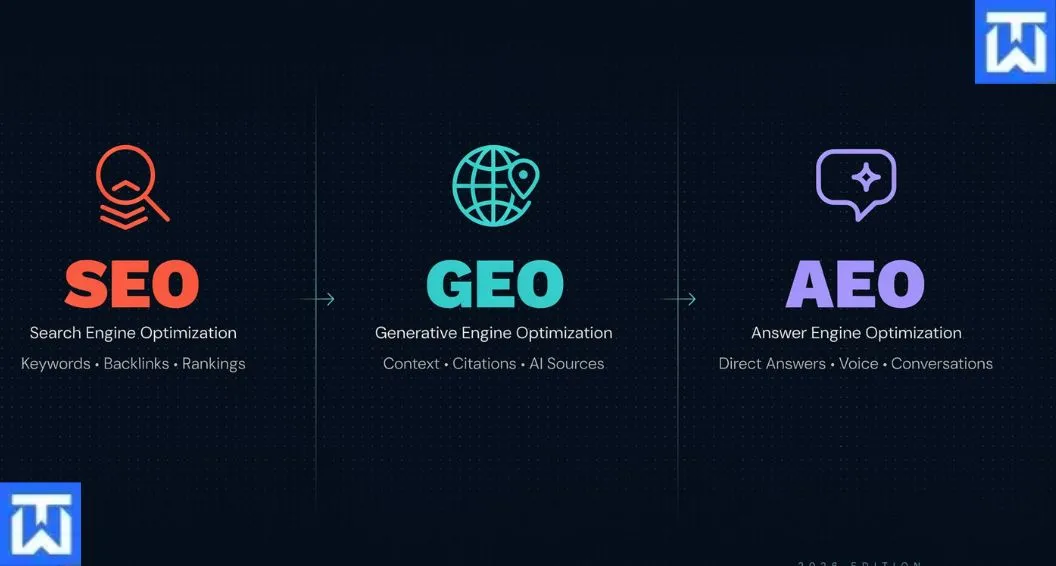
AEO, or answer engine optimisation, commonly describes preparing content for direct answers. GEO, or generative engine optimisation, commonly describes improving visibility in AI-generated responses.
For Google AI Overviews and AI Mode, foundational SEO practices still apply. Google does not require special AI markup or a separate optimisation method. Eligibility does not guarantee inclusion.
Our practical recommendation is to make information accessible and easy to evaluate:
Answer the reader’s main question near the start.
Use descriptive headings and explain technical terms.
Support important claims with primary sources.
Keep essential information available as readable text.
Use crawlable links to relevant supporting pages.
Keep the publisher, author information and business details accurate.
These practices improve clarity and accessibility. They should not be presented as a formula for winning citations across different AI platforms.
What commonly slows a website down
Several causes can combine on the same page. Let the measurements determine which deserves attention first.
| Cause | What to investigate | Possible improvement |
| Heavy images | File size, display size and responsive selection | Resize and compress; use suitable WebP or AVIF assets. |
| Slow initial response | Hosting, redirects, application work and cache misses | Reduce server work and improve caching where appropriate. |
| Excessive JavaScript | Long tasks and unused or repeated scripts | Remove unnecessary code and split expensive tasks. |
| Third-party tools | Chat, advertising, analytics and embedded media | Remove duplication and review loading behaviour. |
| Render-blocking resources | Styles or synchronous scripts delaying rendering | Prioritise required styles and defer suitable scripts. |
| Unstable layouts | Missing dimensions and late inserted elements | Reserve space and adjust template behaviour. |
A CDN can reduce delivery latency for cacheable resources, particularly for geographically dispersed visitors. It does not remove the execution cost of heavy JavaScript on a customer’s phone.
How do you diagnose a slow website
1 Select pages that represent important journeys
Test your homepage, a major service or product page, an important organic landing page, and a contact or checkout journey. Include common templates rather than relying on one URL.
2 Check realuser performance
Use Search Console’s Core Web Vitals report to identify affected groups. In PageSpeed Insights, note whether field measurements describe the specific URL or the wider origin.
3 Investigate the delays
Use Lighthouse diagnostics, browser developer tools or WebPageTest. Identify the LCP element, inspect requests and test interactions. Repeat lab measurements under consistent conditions rather than treating a single run as definitive.
4 Connect performance with business outcomes
If you want to analyse speed against conversions in GA4, collect performance events using an implementation such as the web-vitals library. Standard landing-page reports alone do not provide each visitor’s Core Web Vitals experience.
Record the baseline and change dates. Compare similar audiences and traffic sources, and treat before-and-after associations cautiously when other changes occurred.
How can you improve website speed?
Optimise important images
Serve images at appropriate dimensions, supply responsive variants and select a suitable format. Avoid lazy-loading an above-the-fold image that is the LCP element. Use high fetch priority or preloading when diagnosis shows it is needed; prioritising too many resources can create competition.
Improve caching and server delivery
Investigate high TTFB before assuming a hosting upgrade is necessary. Review application processing, redirects and cache behaviour. Configure page caching for suitable public pages, while excluding personalised sessions, carts and other content that must remain user-specific.
Enable appropriate text compression and verify actual responses. Compression can reduce transfer size but does not necessarily fix server processing delays.
Reduce unnecessary browser work
Remove unused scripts and duplicate tags. Review plugin output rather than judging a WordPress site by plugin count alone. Test deferred loading carefully: forms, accessibility, measurement and essential interactions must continue to work.
Fix shared templates
Reserve image and embed space, improve font behaviour and prevent banners from displacing content. Template changes can improve many pages, so test the shared header, navigation and forms after each release.
Adapt the work to the platform
WordPress: Review theme output, caching, database work, images and plugin assets.
Shopify: Review theme code, app embeds, media and third-party scripts within the platform’s controls. Apps vary in their performance impact.
Custom websites: Review rendering, bundle size, server processing and third-party dependencies. A custom implementation can still be slow.
A practical 30 day performance plan
| Period | Work | Evidence to retain |
| Week 1 | Measure key templates and journeys. | Field-data availability, repeatable lab tests and business baselines. |
| Week 2 | Fix the largest confirmed bottlenecks. | Before-and-after diagnostics and functional checks. |
| Week 3 | Improve shared templates and script behaviour. | Interaction tests and checks across affected page types. |
| Week 4 | Review results and assign ongoing ownership. | Remaining issues, monitoring arrangements and a monthly review date. |
Lab improvements may appear immediately after deployment. Rolling field data takes time to reflect new experiences. Ranking and conversion changes follow no guaranteed timetable.
Make your website easier to use
Start with the pages customers rely on. Measure the current experience, fix the largest confirmed delays and check that each change helps visitors complete their tasks.
For help reviewing your website’s performance and technical SEO, visit Techish Web and contact the team about your site’s needs.
Frequently asked questions
How fast should a website load
Use specific experience targets: LCP at or below 2.5 seconds, INP at or below 200 milliseconds, and CLS at or below 0.1, assessed at the 75th percentile. Also test whether customers can complete important tasks without unnecessary delays.
Is a PageSpeed Insights score of 100 necessary
No. Use the score to support diagnosis, alongside real-user measurements and functional testing. Prioritise improvements that address an actual bottleneck or customer problem.
Why is my website fast on my computer but slow in tests
Your device, network, cached resources and location may differ from the test conditions or your visitors’ circumstances. Compare the conditions and read the field data before deciding which result represents your audience.
Should I install more speed optimisation plugins
Only when a tool addresses a diagnosed need. Overlapping caching and optimisation settings can create conflicts. Confirm what the host already provides and test changes individually.
Will faster pages receive more AI citations
There is no guaranteed speed-to-citation relationship. Improve delivery and accessibility while publishing clear, relevant and well-supported information. Different AI services have different retrieval and inclusion systems.
Can I measure revenue lost because of speed
You can investigate the relationship using performance measurements, conversion data and suitable experiments. A generic calculator cannot isolate the causal effect of speed on your business.
How often should website performance be checked
Review it after substantial template, plugin, tracking or media changes. A monthly review is a practical starting point, with more frequent monitoring for important customer journeys.